Plans,Stat.&Res. Report
Date: 2025/06/19
|
Year Objective item |
2024 |
2025 |
2026 |
2027 |
2028 |
2029 |
|---|---|---|---|---|---|---|
|
Water Sale |
2,617,249 | 2,641,589 | 2,657,967 | 2,690,394 | 2,717,567 | 2,743,927 |
|
Leakage Rate(%) |
12.00 | 11.71 | 11.42 | 11.13 | 10.84 | 10.56 |
|
Sales Rate(%) |
79.90 | 80.19 | 80.48 | 80.77 | 81.06 | 81.34 |
|
Water Supply |
3,275,656 | 3,294,163 | 3,302,643 | 3,330,932 | 3,352,538 | 3,373,404 |
|
Water Supply |
4,859,757 | 4,881,876 | 4,896,476 | 4,973,126 | 4,973,126 | 4,973,126 |
|
Quality |
99.937 | 99.939 | 99.941 | 99.943 | 99.945 | 99.947 |
|
Tap Water Popularity |
94.95 | 95.15 | 95.30 | 95.45 | 95.60 | 95.75 |
|
Customer Satisfactory |
95 | 95.1 | 95.2 | 95.3 | 95.4 | 95.5 |
|
Carbon reduction(tCO2e) |
100,360 | 102,340 | 105,590 | 109,110 | 114,050 | 117,540 |
|
Management Issue |
Qualitative Objective |
|---|---|
|
Increasing risk of water shortage |
Carrying out plenty volume and high quality, enhance our core capabilities. |
|
Great change in customers’ expectations |
Starting from our hearts, touch our customers. |
|
Severe human dilemma |
Optimizing the organization structure. |
|
Growing environmental consciousness |
net zero emissions. |
|
Financial deterioration |
Increasing revenues and cutting costs, improve financial structure. |
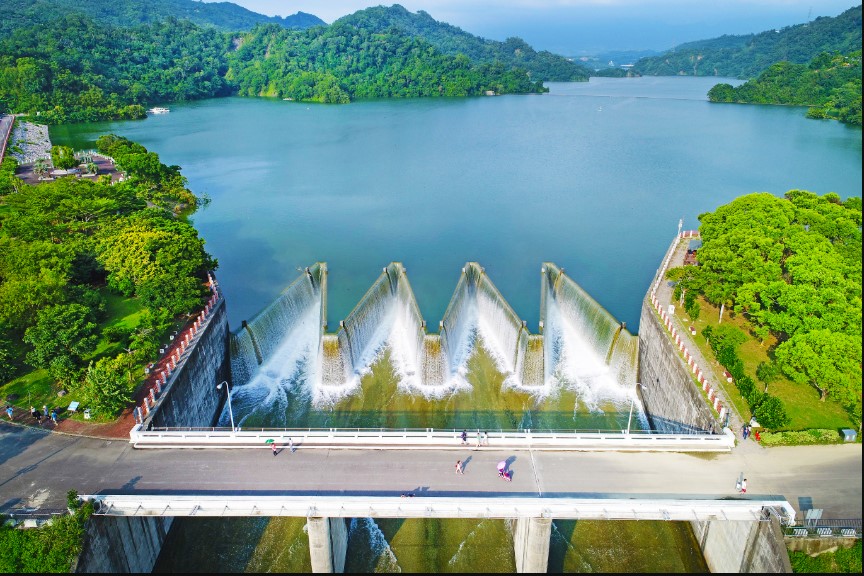
 Reservoir


