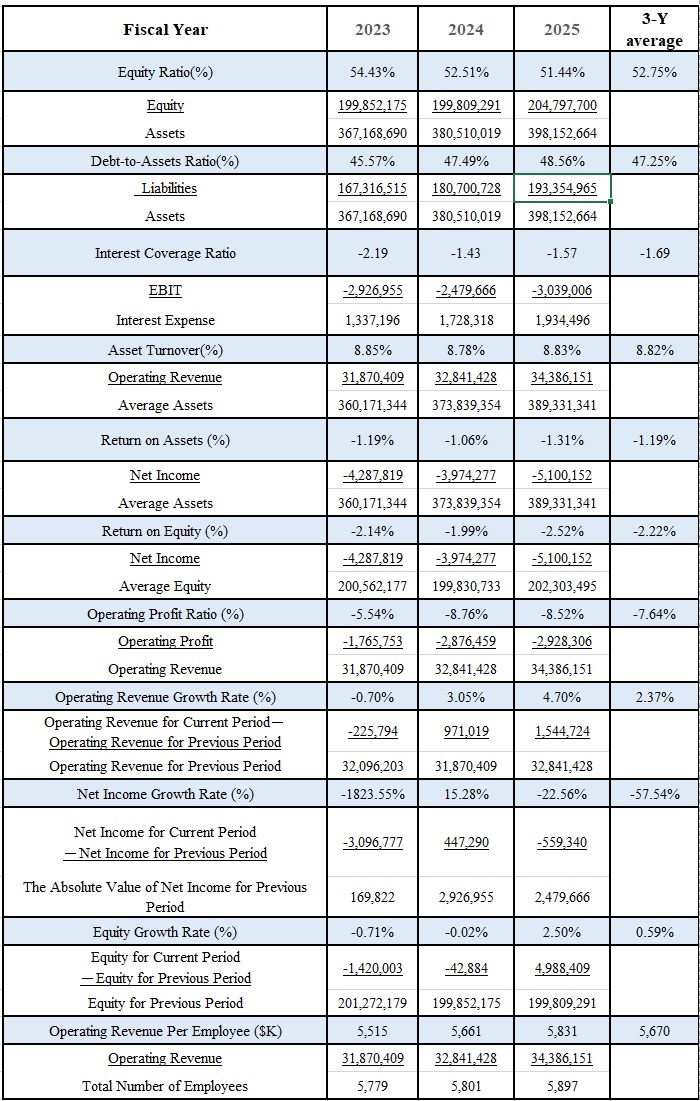
Finance
Fiscal Year |
2022 |
2023 |
2024 |
3-Y average |
---|---|---|---|---|
Equity Ratio(%) |
56.99% |
54.43% |
52.52% |
54.59% |
Equity Assets |
201,272,179 353,173,998 |
199,852,175 367,168,690 |
199,834,156
380,513,912 |
|
Debt-Equity Ratio(%) |
43.01% |
45.57% |
47.48% |
45.41% |
Liabilities Assets |
151,901,820 353,173,998 |
167,316,515 367,168,690 |
180,679,756 380,513,912 |
|
Interest Coverage Ratio |
1.20 |
-2.19 |
-1.42 |
-1.17 |
EBIT Interest Expense |
-909,840 757,961 |
-2,926,955 1,337,196 |
-2,454,683 1,728,435 |
|
Asset Turnover(%) |
9.22% |
8.85% |
8.78% |
8.95% |
Operating Revenue Average Assets |
32,096,203 348,145,940 |
31,870,409
360,171,344 |
32,841,428 373,841,301 |
|
Return on Assets (%) |
0.02% |
-1.19% |
-1.06% |
-0.74% |
Net Income Average Assets |
-71,230 348,145,940 |
-4,287,819 360,171,344 |
-3,949,413 373,841,301 |
|
Return on Equity (%) |
0.04% |
-2.14% |
-1.98% |
-1.36% |
Net Income Average Equity |
71,230 199,338,109 |
-4,287,819 200,562,177 |
-3,949,413 199,843,166 |
|
Operating Profit Ratio (%) |
2.94% |
-5.54% |
-8.68% |
-3.80% |
Operating Profit Operating Revenue |
942,109 32,096,203 |
-1,765,753 31,870,409 |
-2,851,477 32,841,428 |
|
Operating Revenue Growth Rate (%) |
3.48% |
-0.70% |
3.05% |
1.92% |
Operating Revenue for Current Period - Operating Revenue for Previous PeriodOperating Revenue for Previous Period Net Income Growth Rate Operating Revenue for Previous Period |
1,079,882 31,016,321 |
-225,794 32,096,203 |
971,019 31,870,409 |
|
Net Income Growth Rate (%) |
197.64% |
-421.70% |
16.14% |
-31.93% |
Net Income for Current Period - Net Income for Previous Period The Absolute Value of Net Income for Previous Period |
1,841,718 931,878 |
-3,836,795 909,840 |
472,272 2,926,955 |
|
Equity Growth Rate (%) |
1.96% |
-0.71% |
-0.01% |
0.41% |
Equity for Current Period - Equity for Previous Period Equity for Previous Period |
3,868,140 197,404,039 |
-1,420,003 201,272,179 |
-18,020 199,852,175 |
|
Operating Revenue Per Employee ($K) |
5,614 |
5,515 |
5,661 |
5,597 |
Operating Revenue Total Number of Employees |
32,096,203 5,717 |
31,870,409 5,779 |
32,841,428 5,801 |
|